
| Goldin Financial Global Centre Latest Property Price Trend (Past 90 Days, Updated Every Saturday) | ||
|---|---|---|
| Avg. price per sqft |
--
|
|
| Volume |
--
|
|
| Profit Ratio |
--
|
|
| Loss Ratio |
--
|
|
| Year Turnover Rate |
--
|
|
| Price 1 yr ago |
--
|
|
| Goldin Financial Global Centre Latest Rental Market (Past 90 Days, Updated Every Saturday) | ||
|---|---|---|
| Avg. rent |
--
|
|
| Volume |
--
|
|
| Rental Yield |
--
|
|
| Rental activity |
--
|
|
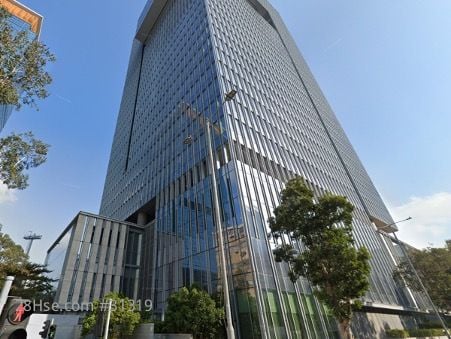
| Goldin Financial Global Centre | HONG LEONG INDUSTRIAL COMPLEX | |
|---|---|---|
| Built | -- | 39 |
| Total Unit | -- | -- |
| AVG Price | -- | HKD$3,715 |
| Changed | -- | -2.80% |
| Volume | -- | -- |
| Profit Ratio | -- | -- |
| Loss Ratio | -- | -- |
| Turnover Rate | -- | -- |
| Listing Price | -- | HKD$4.9 M - HKD$32.74 M |
| Rental | -- | $14.0 |
| Rental Yield | -- | ~ 4.6% |
| Rental activity | -- | -- |
|
|
|